

Calculation practice: Analyze results from a TukeyKramer test. Using the same data as in Practice Problem 1,
Question:
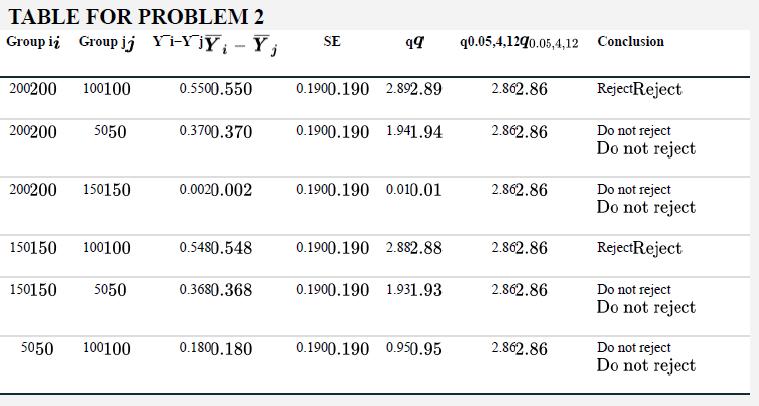
Calculation practice: Analyze results from a Tukey–Kramer test. Using the same data as in Practice Problem 1, use the results from a Tukey–Kramer test to illustrate which of the pairs of groups are significantly different in their means. The Tukey–Kramer test computations are given in the table at the bottom of this page.
a. What null hypotheses are being tested by the Tukey–Kramer procedure?
b. On a single line of text, write the sample mean of the four treatment groups, from smallest to largest.
c. Begin from the largest sample mean on the right. Draw a line underneath this sample mean, and continue the line to the left until it underlines all sample means whose group means are not significantly different from the largest mean.
d. Now move to the next largest mean, second from right. Draw a line underneath this sample mean to the left until it underlines all sample means whose group means are not significantly different. Keep this line if it extends farther to the left than the line from part (c); otherwise, discard it because it contains no new information.
e. Now move to the next largest mean, third from right. Repeat the procedure outlined in part (d). Continue the procedure in (c) and (d) until it has been carried out on all the means. When you reach the smallest mean, create a new underline if this group mean has not yet been underlined in a previous step.
f. Assign each unique line a symbol such as “a,” “b,” and so on. Under each of the four sample means, write the symbols for all the lines that underline it. Give a group more than one symbol (e.g., “a,b”) if it is underlined by more than one unique underline.
g. Use the underlines and symbols from part (f) to summarize in words the overall results of the Tukey–Kramer test. That is, state which means group together on the basis of statistical significance.
Data from problem
Calculation practice: Analysis of variance. Many humans like the effect of caffeine, but it occurs in plants as a deterrent to herbivory by animals. Caffeine is also found in flower nectar, and nectar is meant as a reward for pollinators, not a deterrent. How does caffeine in nectar affect visitation by pollinators? Singaravelan et al. (2005) set up feeding stations where bees were offered a choice between a control solution with 20% sucrose or a caffeinated solution with 20% sucrose plus some quantity of caffeine. Over the course of the experiment, four different concentrations of caffeine were provided: 50, 100, 150, and 200 ppm. The response variable was the difference between the amount of nectar consumed from the caffeine feeders and that removed from the control feeders at the same station (in grams). Here are the data and strip chart, including standard error bars:
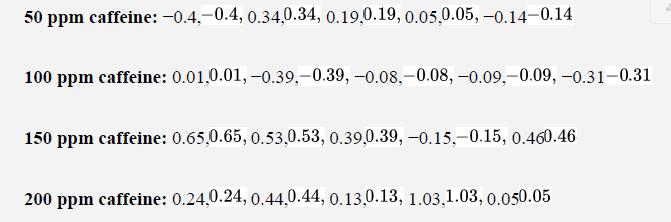
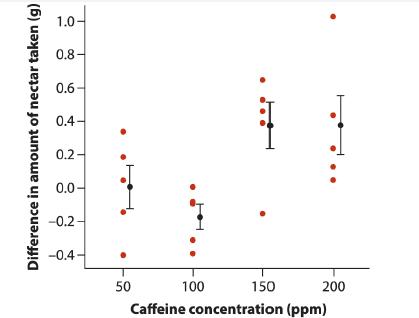
Does the mean amount of nectar taken depend on the concentraton of caffeine in the nectar? We will carry out an analysis of variance to find out.
Step by Step Answer:
a What null hypotheses are being tested by the TukeyKramer procedure The TukeyKramer procedure tests the null hypothesis that all group means are equa...View the full answer


The Analysis Of Biological Data
ISBN: 9781319226237
3rd Edition
Authors: Michael C. Whitlock, Dolph Schluter
