

Human diseases differ in their virulence, which is defined as their ability to cause harm. Scientists are
Question:
Human diseases differ in their virulence, which is defined as their ability to cause harm. Scientists are interested in determining what features of different diseases make some more dangerous to their hosts than others. The graph below depicts the frequency distribution of virulence measurements, on a logbase 10 scale, of a sample of human diseases (data from Ewald 1993). Diseases that spread from one victim to another by direct contact between people are shown in the upper graph. Those transmitted from person to person by insect vectors are shown in the lower graph.
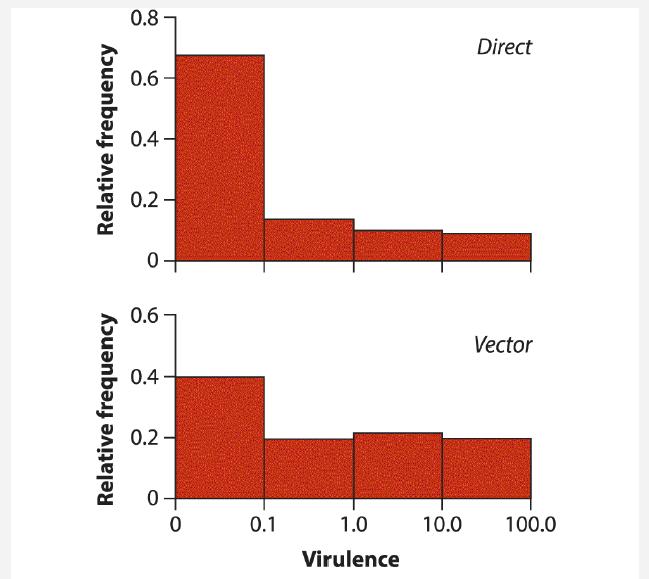
a. Identify the type of graph displayed.
b. What are the two groups being compared in this graph?
c. What variable is being compared between the two groups? Is it numerical or categorical?
d. Explain the units on the vertical (y) axis
e. What is the main result depicted by this graph?
Step by Step Answer:
a Grouped histograms b Groups are disease types diseases ...View the full answer


The Analysis Of Biological Data
ISBN: 9781319226237
3rd Edition
Authors: Michael C. Whitlock, Dolph Schluter
