

Refer to the previous problem. a. Draw a box plot using the information provided in the graph
Question:
Refer to the previous problem.
a. Draw a box plot using the information provided in the graph in that problem.
b. Label three features of this box plot.
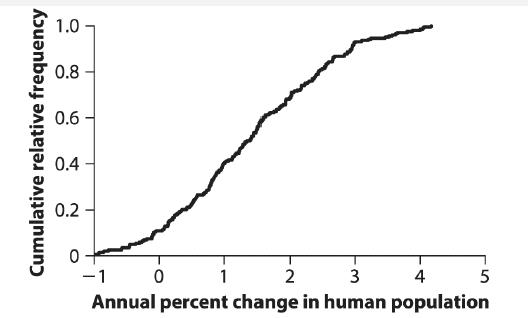
Data from previous problem
The following graph shows the population growth rates of the 204 countries recognized by the United Nations. Growth rate is measured as the average annual percent change in the total human population between 2000 and 2004 (United Nations Statistics Division 2004).
Fantastic news! We've Found the answer you've been seeking!
Step by Step Answer:
a Drawing a Box Plot A box plot also known as a boxandwhisker plot can be constructed using the info...View the full answer

Answered By
PALASH JHANWAR
I am a Chartered Accountant with AIR 45 in CA - IPCC. I am a Merit Holder ( B.Com ). The following is my educational details.
PLEASE ACCESS MY RESUME FROM THE FOLLOWING LINK: https://drive.google.com/file/d/1hYR1uch-ff6MRC_cDB07K6VqY9kQ3SFL/view?usp=sharing
3+ Reviews
10+ Question Solved
Related Book For 

The Analysis Of Biological Data
ISBN: 9781319226237
3rd Edition
Authors: Michael C. Whitlock, Dolph Schluter
Question Posted:
