

Niderkorns (1872; from Pounder 1995) measurements on 114 human corpses provided the first quantitative study on the
Question:
Niderkorn’s (1872; from Pounder 1995) measurements on 114 human corpses provided the first quantitative study on the development of rigor mortis. The data in the following table give the number of bodies achieving rigor mortis in each hour after death, recorded in one-hour intervals.
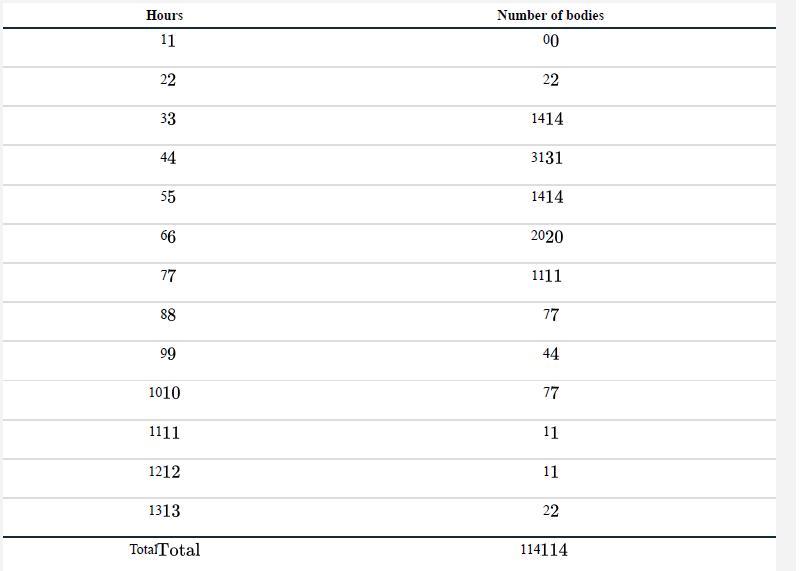
a. Calculate the mean number of hours after death that it took for rigor mortis to set in.
b. Calculate the standard deviation in the number of hours until rigor mortis.
c. What fraction of observations lie within one standard deviation of the mean (i.e., between the value ![]()
d. Calculate the median number of hours until rigor mortis sets in. What is the likely explanation for the difference between the median and the mean?
e. Computer optional: Create a box plot for these data. Is the distribution of time to rigor mortis symmetric?
Step by Step Answer:
a 57 hours b 24 hours c 83114073 73 d Median5 hours ...View the full answer


The Analysis Of Biological Data
ISBN: 9781319226237
3rd Edition
Authors: Michael C. Whitlock, Dolph Schluter
