

The figure at the bottom of the page shows the probability density of colony diameters (in mm)
Question:
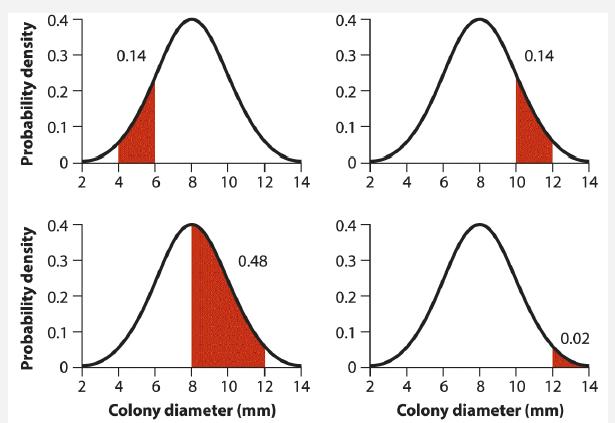
The figure at the bottom of the page shows the probability density of colony diameters (in mm) in a hypothetical population of Paenibacillus bacteria. The distribution is continuous, so the probability of sampling a colony within some range of diameter values is given by area under the curve. Numbers next to the curve indicate the area of the region indicated in red. Consider the case in which a single colony is randomly sampled from the population.
a. Are the events “diameter is between 4 and 6” and “diameter is between 8 and 12” mutually exclusive? Explain.
b. What is the probability that a randomly chosen colony diameter is between 4 and 6 or between 8 and 12?
c. What is the probability that a randomly chosen colony diameter is greater than or equal to 10?
d. What is the probability that a randomly chosen colony diameter is between 8 and 10?
e. What is the probability that a randomly chosen colony diameter is between 8 and 12 or greater than or equal to 10?
Step by Step Answer:
ANSWER Solution a Are the events diameter is between 4 and ...View the full answer


The Analysis Of Biological Data
ISBN: 9781319226237
3rd Edition
Authors: Michael C. Whitlock, Dolph Schluter
