

The four graphs on the next page are all based on random samples with more than 100
Question:
The four graphs on the next page are all based on random samples with more than 100 individuals. The red dots represent sample means.
a. Assume that the error bars extend two standard errors above and two standard errors below the sample means. For which graphs can we conclude that group 1 is significantly different from group 2?
b. Assume that the error bars mark 95% confidence intervals. For which graphs can we conclude that group 1 is significantly different from group 2?
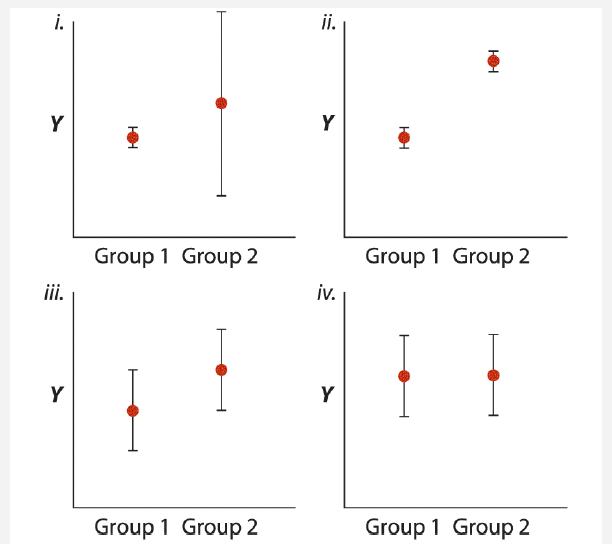
c. Assume that the error bars extend one standard error above and one standard error below the sample means. For which graphs can we conclude that group 1 is significantly different from group 2?
d. Assume that the error bars extend two standard deviations above and two standard deviations below the sample means. For which graphs can we conclude that group 1 is significantly different from group 2?
Step by Step Answer:
a ii b ii c From ii we can still be fairly confident that the g...View the full answer


The Analysis Of Biological Data
ISBN: 9781319226237
3rd Edition
Authors: Michael C. Whitlock, Dolph Schluter
