

The table at the top of the page lists the means and standard deviations of several different
Question:
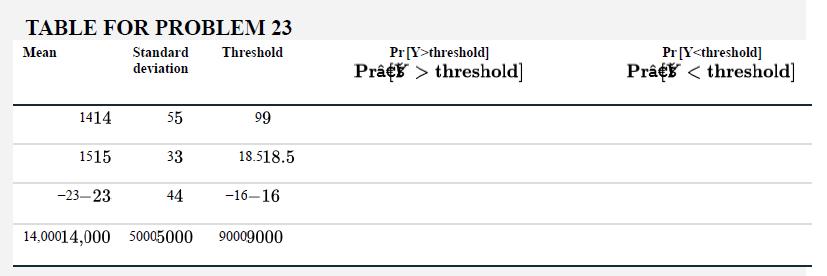
The table at the top of the page lists the means and standard deviations of several different normal distributions. For each distribution, calculate the probability of drawing a single Y value greater than the given threshold and the probability of drawing a value less than that threshold.
Fantastic news! We've Found the answer you've been seeking!
Step by Step Answer:
To calculate the probability of drawing a single value greater than or less than a given threshold f...View the full answer

Answered By
Muhammad Umair
I have done job as Embedded System Engineer for just four months but after it i have decided to open my own lab and to work on projects that i can launch my own product in market. I work on different softwares like Proteus, Mikroc to program Embedded Systems. My basic work is on Embedded Systems. I have skills in Autocad, Proteus, C++, C programming and i love to share these skills to other to enhance my knowledge too.
1+ Reviews
10+ Question Solved
Related Book For 

The Analysis Of Biological Data
ISBN: 9781319226237
3rd Edition
Authors: Michael C. Whitlock, Dolph Schluter
Question Posted:
