

Question: In your physics lab you release a small glider from rest at various points on a long, frictionless air track that is inclined at an
(a) How can you re-graph the data so that the data points fall close to a straight line? You might want to plot x or t, or both, raised to some power.
(b) Construct the graph you described in part (a) and find the equation for the straight line that is the best fit to the data points.
(c) Use the straightline fit from part (b) to calculate the acceleration of the glider.
(d) The glider is released at a distance x = 1.35 m from the bottom of the track. Use the acceleration value you obtained in part (c) to calculate the speed of the glider when it reaches the bottom of the track.
Figure P2.84
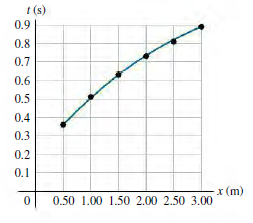
t (s) 0.9 0.8 0.7 0.6 0.5 0.4 0.3 0.2 0.1 x (m) 0.50 1.00 1.50 2.00 2.50 3.00
Step by Step Solution
3.51 Rating (174 Votes )
There are 3 Steps involved in it
IDENTIFY Interpret the data on a graph to draw conclusions about the motion of a glider having const... View full answer

Get step-by-step solutions from verified subject matter experts