

Question: A researcher is testing the null hypothesis that μ = 120, with Ï M = 20. In reality, the population mean is 140. (a) Draw
(a) Draw a figure like Figure 6.12. Designate in the figure the areas representing Type II error and power.
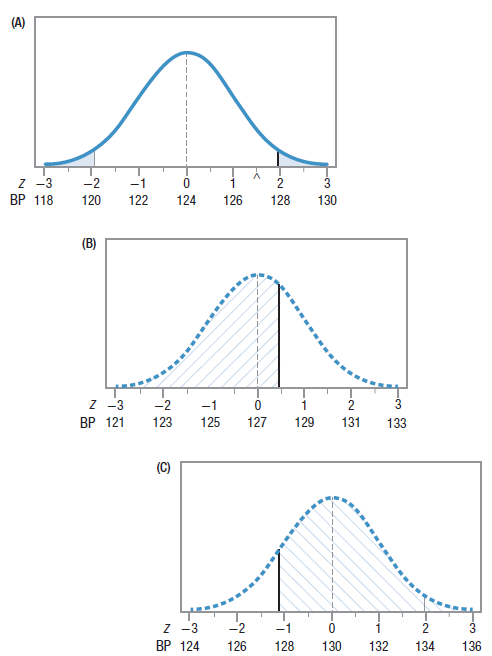
(b) Does one need to worry about Type I error?
(A) Z -3 BP 118 -2 -1 120 122 124 126 128 130 (B) z -3 3 -2 -1 125 BP 121 123 127 129 131 133 (C) Z -3 BP 124 -2 -1 126 128 130 132 134 136
Step by Step Solution
★★★★★
3.35 Rating (170 Votes )
There are 3 Steps involved in it
1 Expert Approved Answer
Step: 1 Unlock

a See the drawin... View full answer
Question Has Been Solved by an Expert!
Get step-by-step solutions from verified subject matter experts
Step: 2 Unlock
Step: 3 Unlock