

Question: Suppose Consumer Reports would like to investigate the linear relationship between the battery life, in hours, and the screen size, in diagonal inches, of a
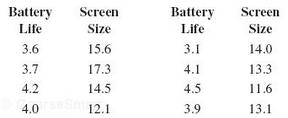
Suppose Consumer Reports would like to investigate the linear relationship between the battery life, in hours, and the screen size, in diagonal inches, of a laptop computer. The following table shows a random sample of eight laptops and the battery life and corresponding screen size of each. These data can also be found in the Excel file battery life. xlsx.
a. Construct a scatter plot for these data.
b. Calculate the slope and the y intercept for the regression equation.
c. Provide an interpretation for the value of the slope.
d. Predict the battery life for a laptop with a 14.5 in. screen size.
e. Calculate the SST.
f. Partition the SST into the SSR and SSE.
Battery Screen Battery Screen Life 3.6 3.7 4.2 4.0 Size 15.6 17.3 14.5 12.1 Life 3.1 4.1 4.5 3.9 Size 14.0 13.3 11.6 13.1
Step by Step Solution
3.45 Rating (181 Votes )
There are 3 Steps involved in it
a b c Because the slope is negative we can conclude that a 1 inch incre... View full answer

Get step-by-step solutions from verified subject matter experts
Document Format (1 attachment)
483-M-S-L-R (3158).docx
120 KBs Word File