

Question: Suppose the EPA would like to investigate the relation-ship between the engine size of sedans and the miles per gallon (MPG) they get. The following
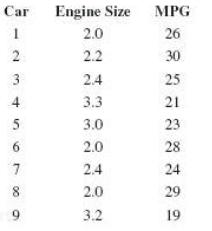
Suppose the EPA would like to investigate the relation-ship between the engine size of sedans and the miles per gallon (MPG) they get. The following table shows the engine size in cubic liters and rated miles per gallon for a selection of 2011 sedans and can also be found in the Excel file engine size.xlsx.
a. Calculate the sample covariance.
b. Calculate the sample correlation coefficient.
c. Describe the relationship between x and y.
Car Engine Size MPG 2.0 2.4 3.3 3.0 2.0 2.4 2.0 3.2 26 30 25 21 23 28 24 29 19
Step by Step Solution
3.38 Rating (160 Votes )
There are 3 Steps involved in it
c There is a negative linear relationship between these two variables ... View full answer

Get step-by-step solutions from verified subject matter experts
Document Format (1 attachment)
483-M-S-N-S (966).docx
120 KBs Word File