

Question: Table 12-4 shows the basic numbers for production of pizzas, holding other factors constant. a. Fill in the blanks in columns (3) and (5). b.
Table 12-4 shows the basic numbers for production of pizzas, holding other factors constant.
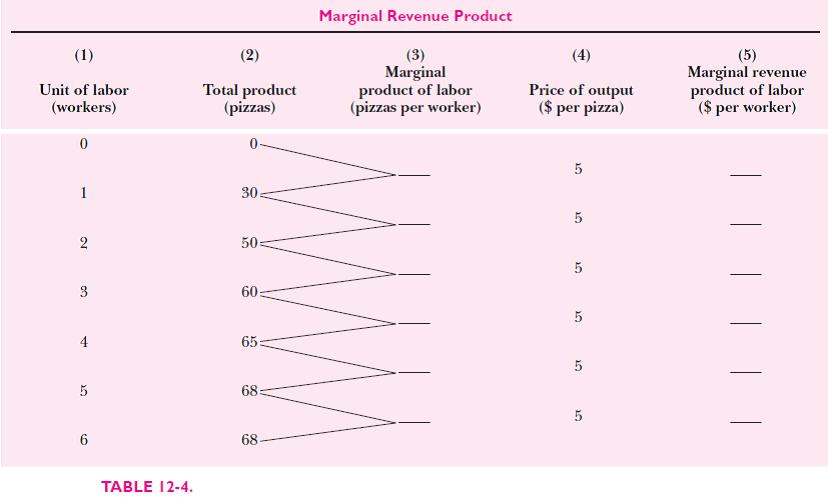
a. Fill in the blanks in columns (3) and (5).
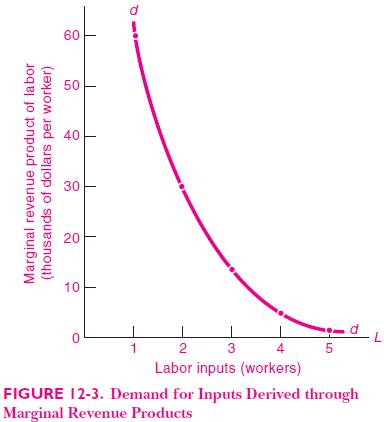
b. Construct a diagram like that in Figure 12-3 which shows the marginal revenue product of pizza workers and labor inputs.
c. If the wage of pizza workers is $30 per worker, how many workers will be employed?
Marginal Revenue Product (1) (2) (3) Marginal product of labor (pizzas per worker) (4) (5) Marginal revenue product of labor ($ per worker) Total product (pizzas) Price of output ($ per pizza) Unit of labor (workers) 1 30 2 50 3 60 4 65 68 68 TABLE 12-4.
Step by Step Solution
3.43 Rating (175 Votes )
There are 3 Steps involved in it
a Marginal Revenue Product is the difference of the to... View full answer

Get step-by-step solutions from verified subject matter experts
Document Format (1 attachment)
673-B-E-M-E (4133).docx
120 KBs Word File