

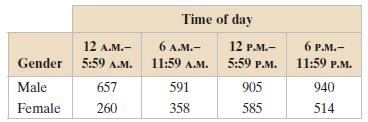
Question: The contingency table shows the distribution of a random sample of fatal pedestrian motor vehicle collisions by time of day and gender in a recent
The contingency table shows the distribution of a random sample of fatal pedestrian motor vehicle collisions by time of day and gender in a recent year. At α = 0.10, can you conclude that time of day and gender are related?
(a) Find the expected frequency for each cell in the contingency table,
(b) Identify the claim and state H0 and Ha,
(c) Determine the degrees of freedom, find the critical value, and identify the rejection region,
(d) Find the chi-square test statistic,
(e) Decide whether to reject or fail to reject the null hypothesis,
(f) Interpret the decision in the context of the original claim. If convenient, use technology.
Time of day 12 A.M. 6 A.M12 P.M. 6 P.M.- Gender 5:59 A.M. 11:59 A.M. 5:59 P.M. 11:59 P.M. Male Female 260 591 358 940 514 657 905 585
Step by Step Solution
3.46 Rating (172 Votes )
There are 3 Steps involved in it
a Expected frequencies b The claim is time of day and gend... View full answer

Get step-by-step solutions from verified subject matter experts
Document Format (1 attachment)
598-M-S-C-S-T (917).docx
120 KBs Word File