

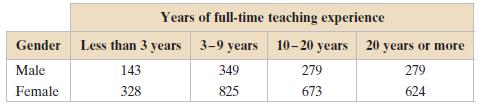
The contingency table shows the results of a random sample of public elementary and secondary school teachers
Question:
The contingency table shows the results of a random sample of public elementary and secondary school teachers by gender and years of full-time teaching experience. At α = 0.01, can you conclude that gender is related to the years of full-time teaching experience?
(a) Find the expected frequency for each cell in the contingency table,
(b) Identify the claim and state H0 and Ha,
(c) Determine the degrees of freedom, find the critical value, and identify the rejection region,
(d) Find the chi-square test statistic,
(e) Decide whether to reject or fail to reject the null hypothesis,
(f) Interpret the decision in the context of the original claim. If convenient, use technology.
Step by Step Answer:
a Expected frequencies b The claim is gender is related to the year...View the full answer


Elementary Statistics Picturing The World
ISBN: 9780321911216
6th Edition
Authors: Ron Larson, Betsy Farber
