

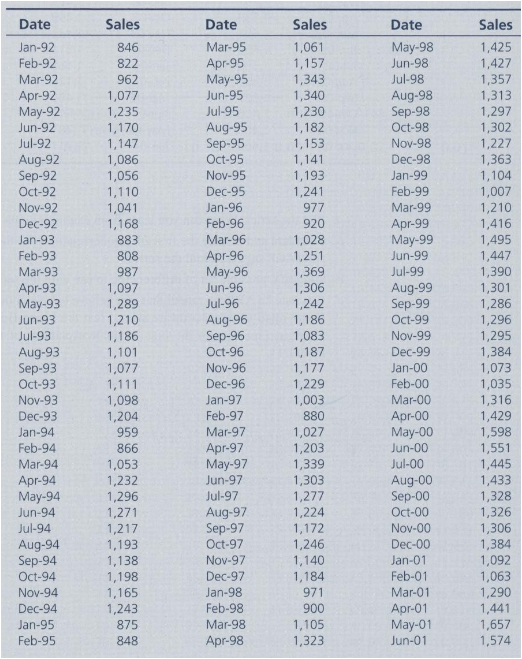
Question: The data below show retail sales at hardware stores in the United States monthly between January 1992 and December 2005. The data are in millions
-1.png)
a. Plot the series. What can you learn from examining this plot?
b. Calculate and display the first 24 autocorrelations for the series. What do the ACF and PACF suggest about the series?
c. Suggest a possible set of differencing to use with the series.
d. Estimate an ARIMA model that you believe to be a good candidate for forecasting future retail sales at hardware stores. Test the Ljung-Box statistic and report your findings. Finally, plot the first 24 autocorrelations of the residuals to your best model.
ate Sales Sales Date Sales Jul-01 Aug-01 Sep-01 1,460 1,437 1,328 1,386 1,399 1,457 1,158 Jul-04 Feb-03 1,555 1,520 9 1,337 Apr-03 1,490 1,743 Oct-04 Nov-01 Dec-01 May-03 Jun-03 1,478 1,581 ov 1,665 1,616 1,537 1,485 1,498 1,432 1,511 1,186 Dec-04 1,297 1,539 1,691 1,605 1,560 Feb-05 Mar-05 Apr-05 May-05 1,442 1,688 1,803 1,770 1,607 1,603 1,562 1,614 1,582 1,673 Oct-03 2 9 Jul-02 Feb-04 Mar-04 Apr-04 1,406 1,619 1,781 Sep-05 Oct-02 1,406 1.400 1,460 Dec-02 Dec-05
Step by Step Solution
3.13 Rating (166 Votes )
There are 3 Steps involved in it
tr msoheightsourceauto col msowidthsourceauto br msodataplacementsamecell style0 msonumberformatGeneral textaligngeneral verticalalignbottom whitespacenowrap msorotate0 msobackgroundsourceauto msopatt... View full answer

Get step-by-step solutions from verified subject matter experts
Document Format (1 attachment)
647-M-S-L-R (6256).xlsx
300 KBs Excel File