

Question: The data in this case come from the 2010 and 2009 annual report of Owens- Illinois.* Note (from 2010 statement 10- K): Common stock, par
The data in this case come from the 2010 and 2009 annual report of Owens- Illinois.*
Note (from 2010 statement 10- K):
Common stock, par value $ 0.01 per share, 250,000,000 shares authorized, 180,808,992 and 179,923,309 shares issued (included treasury shares), respectively. Treasury stock, at cost, 17,093,509 and 11,322,544 shares, respectively.
(This is from the consolidated balance sheet December 31, 2010 and 2009.)
Common stock market price:
December 31, 2010 $ 30.70
December 31, 2009 $ 32.87
December 31, 2008 $ 27.33
a. Compute the following ratios for 2008– 2010:
1. Current ratio
2. Debt ratio
3. Gross profit margin
4. Operating cash flow/total debt
b. Comment on the ratios in (a)
c. Asbestos- related
1. For the three- year period 2008– 2010, how much was recognized in expense for asbestos- related costs?
2. For the three- year period 2008– 2010, how much was paid for asbestos- related payments?
3. Why is there a difference between the expense and the cash payments for asbestos-related payments for the period 2008– 2010?
4. Compute by year (2008– 2010) the impact that asbestos charges (expense and payments) had on net cash provides ( used) in operating activities.
d. 1. Compute the total capitalization for 2010 and 2009 (outstanding shares of common stock X market price).
2. Compare the total shareowners’ equity related to common stock, with the capitalization. Comment on the difference.
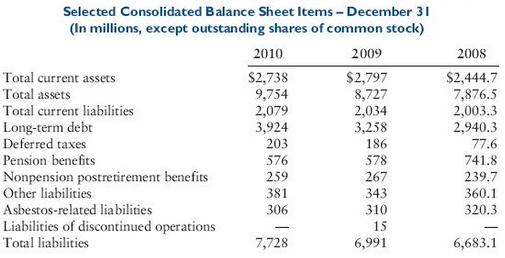
Selected Consolidated Balance Sheet Items - December 31 (In millions, except outstanding shares of common stock) 2010 2009 2008 $2,738 9,754 2,079 3,924 203 Total current assets $2,797 8,727 2,034 3,258 186 $2,444.7 7,876.5 2,003.3 2,940.3 Total assets Total current liabilities Long-term debt Deferred taxes Pension benefits 77.6 576 578 741.8 Nonpension postretirement benefits Other liabilities 267 239.7 259 381 343 360.1 Asbestos-related liabilities 320.3 306 310 Liabilities of discontinued operations Total liabilities 15 6,991 7,728 6,683.1
Step by Step Solution
3.46 Rating (166 Votes )
There are 3 Steps involved in it
a 1 Current ratio 2010 2009 2008 Current assets a 2738 2797 24447 Current liabilities b 2079 2034 20... View full answer

Get step-by-step solutions from verified subject matter experts
Document Format (1 attachment)
304-B-A-F-R (1285).docx
120 KBs Word File