

Question: The data table compares men who viewed television violence with those who did not, in order to study the differences in physical abuse of the
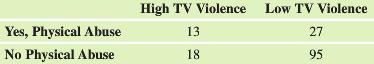
The data table compares men who viewed television violence with those who did not, in order to study the differences in physical abuse of the spouse. For the men in the table, test whether television violence and abusiveness are associated, using a significance level of 0.05.
Refer to the Minitab output.
-2.png)
Yes, Physical Abuse No Physical Abuse High TV Violence 13 18 Low TV Violence 27 95 Chi-Square Test: High Tv Violence, Low Tv violence Expected counts are printed below observed counts Chi-Square contributions are printed below expected counts High TV Low TV violence violence Total 40 13 8.10 2.957 27 31.90 0.751 Yes, Ab 113 18 22.90 1.047 95 90.10 0.266 No Total 31 122 153 Chi-sq5.021, DF , P-Value 0.025
Step by Step Solution
3.35 Rating (158 Votes )
There are 3 Steps involved in it
Step 1 H 0 For men watching violent TV is independent ... View full answer

Get step-by-step solutions from verified subject matter experts
Document Format (1 attachment)
484-M-S-N-S (733).docx
120 KBs Word File