

Question: The estimated percent distribution of the U.S. population for 2020 is shown in the pie chart. Find each probability. (a) Randomly selecting someone who is
The estimated percent distribution of the U.S. population for 2020 is shown in the pie chart. Find each probability.
(a) Randomly selecting someone who is under 5 years old
(b) Randomly selecting someone who is 45 years or over
(c) Randomly selecting someone who is not 65 years or over
(d) Randomly selecting someone who is between 20 and 34 years old
U.S. Age Distribution
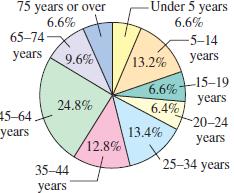
75 years or over 65-74 years/0.69A years 9.6% Under 5 years 6.6% 66% 5-14 / 13.2% 6.6%+13-19 6.41 Years 20-24 13.4%/ years 24.8% / 5-64 years 12.8% 25-34 years 35-44 years
Step by Step Solution
3.52 Rating (159 Votes )
There are 3 Steps involved in it
a Punder 5 0066 b P45 P45 64 P65 746 P... View full answer

Get step-by-step solutions from verified subject matter experts
Document Format (1 attachment)
598-M-S-P (4730).docx
120 KBs Word File