

The following data from a study of four American manufacturing companies are available for a simple linear
Question:
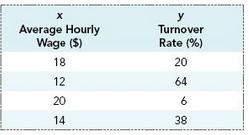
The following data— from a study of four American manufacturing companies— are available for a simple linear regression analysis attempting to link average hourly wage (x) to employee turnover rates (y).
a. Show the data in a scatter diagram and use the least squares criterion to find the slope (b) and the intercept (a) for the best fitting line. Sketch the least squares line in your scatter diagram.
b. Verify that the least squares line here passes through the point (x, y), where x is the average x value and y is the average y value.
c. According to the line you fit, a $ 1 increase in hourly wage can be associated a ____% decrease in the turnover rate.
Fantastic news! We've Found the answer you've been seeking!
Step by Step Answer:
a x y xy x 2 18 20 360 324 12 64 768 144 20 6 120 400 14 38 532 196 S ...View the full answer

Answered By
Pushpinder Singh
Currently, I am PhD scholar with Indian Statistical problem, working in applied statistics and real life data problems. I have done several projects in Statistics especially Time Series data analysis, Regression Techniques.
I am Master in Statistics from Indian Institute of Technology, Kanpur.
I have been teaching students for various University entrance exams and passing grades in Graduation and Post-Graduation.I have expertise in solving problems in Statistics for more than 2 years now.I am a subject expert in Statistics with Assignmentpedia.com.
3+ Reviews
10+ Question Solved
Related Book For 

Understanding Business Statistics
ISBN: 978-1118145258
1st edition
Authors: Stacey Jones, Tim Bergquist, Ned Freed
Question Posted:
