

Question: The following data were obtained when a Ca 2+ ion-selective electrode was immersed in standard solutions whose ionic strength was constant at 2.0 M. (a)
The following data were obtained when a Ca2+ ion-selective electrode was immersed in standard solutions whose ionic strength was constant at 2.0 M.
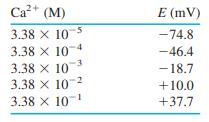
(a) Prepare a calibration curve and find the least-squares slope and intercept and their standard deviations.
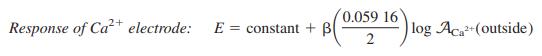
(b) Calculate the value of in Equation 14-13.
(c) For a measured potential, the calibration curve gives us log[Ca2+]. We can compute [Ca2+] = 10log[Ca2+] . Using rules for propagation of uncertainty in Table 3-1, calculate [Ca2+] and its associated uncertainty of a sample that gave a reading of -22.5 (± 0.3) mV in four replicate measurements.
Equation 14-13
Ca+ (M) E (mV) 3.38 x 10 -74.8 3.38 X 10 -46.4 3.38 X 10 3.38 X 10⁻² 3.38 X 10 -18.7 +10.0 +37.7
Step by Step Solution
3.40 Rating (172 Votes )
There are 3 Steps involved in it
a b c The least squares parameters are E 5110 024 2814 0085 log Ca E mV 40 20 ... View full answer

Get step-by-step solutions from verified subject matter experts
Document Format (1 attachment)
878-E-C-E-E-C (2062).docx
120 KBs Word File