

The following drawings represent solutions at various stages of the titration of a weak acid, HA, with
Question:
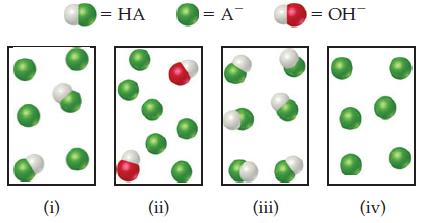
The following drawings represent solutions at various stages of the titration of a weak acid, HA, with NaOH. (The Na+ ions and water molecules have been omitted for clarity.) To which of the following regions of the titration curve does each drawing correspond:
(a) Before addition of NaOH,
(b) After addition of NaOH but before equivalence point,
(c) At equivalence point,
(d) After equivalence point? [Section 17.3]
Fantastic news! We've Found the answer you've been seeking!
Step by Step Answer:
AnalyzePlan Consider the reaction HA OH A H 2 0 What are the major species present ...View the full answer

Answered By
Pharashram rai
i am highly creative, resourceful and dedicated freelancer an excellent record of successful classroom presentations and writing . I have more than 4 years experience in tutoring students especially by using my note making strategies and engineering field . Especially adept at teaching methods of maths and writing , and flexible teaching style with the willingness to work beyond the call of duty. Committed to ongoing professional development and spreading the knowledge within myself to the blooming ones to make them fly with .
65+ Reviews
270+ Question Solved
Related Book For 

Chemistry The Central Science
ISBN: 978-0321696724
12th edition
Authors: Theodore Brown, Eugene LeMay, Bruce Bursten, Catherine Murphy, Patrick Woodward
Question Posted:
