

The following graphs show the temperature of different solutions with chemical reactions as functions of time. Graph
Question:
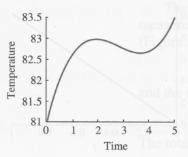
The following graphs show the temperature of different solutions with chemical reactions as functions of time. Graph the rate of change of temperature in each case, and indicate when the solution is warming up and when it is cooling down.
Fantastic news! We've Found the answer you've been seeking!
Step by Step Answer:
Rate of change of t...View the full answer

Answered By
SUMAN DINDA
I LIKE TO TEACH STUDENTS. SO, I START MYSELF AS A PRIVATE TUTOR. I TEACH STUDENTS OF DIFFERENT CLASSES. I HAVE ALSO DONE BACHELOR OF EDUCATION DEGREE(B.ED). DURING THIS COURSE I HAD TO TEACH IN A SCHOOL. SO I HAVE A GOOD EXPERIENCE IN TEACHING.
1+ Reviews
10+ Question Solved
Related Book For 

Modeling the Dynamics of Life Calculus and Probability for Life Scientists
ISBN: 978-0840064189
3rd edition
Authors: Frederick R. Adler
Question Posted:
