

The following graphs show marginal cost curves for two firms that would like to form a cartel
Question:
The following graphs show marginal cost curves for two firms that would like to form a cartel in the market in which they are selling.
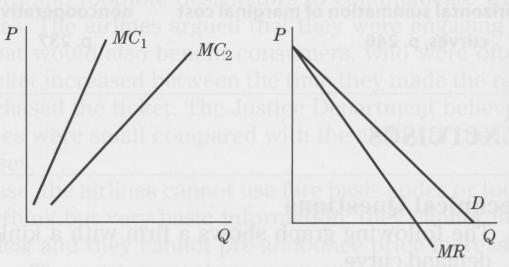
a. Use the two marginal cost curves to construct a combined marginal cost curve, and plot that on the market graph.
b. Label the cartel’s profit-maximizing output and price, as well as the output of each cartel member has an incentive to cheat on the agreement.
Fantastic news! We've Found the answer you've been seeking!
Step by Step Answer:
a The total marginal cost curve is the horizontal su...View the full answer

Answered By
Khurram shahzad
I am an experienced tutor and have more than 7 years’ experience in the field of tutoring. My areas of expertise are Technology, statistics tasks I also tutor in Social Sciences, Humanities, Marketing, Project Management, Geology, Earth Sciences, Life Sciences, Computer Sciences, Physics, Psychology, Law Engineering, Media Studies, IR and many others.
I have been writing blogs, Tech news article, and listicles for American and UK based websites.
5+ Reviews
17+ Question Solved
Related Book For 

Question Posted:
