

Question: The following table lists the math SAT scores for 72 students. These data can also be found in the excel file math SAT scores. xlsx.
The following table lists the math SAT scores for 72 students. These data can also be found in the excel file math SAT scores. xlsx.
a. Using the 2k > n rule, construct a frequency distribution for these data.
b. Using the results from part a, calculate the relative frequencies for each class.
c. Using the results from part a, calculate the cumulative relative frequencies for each class.
d. Construct a histogram for these data.
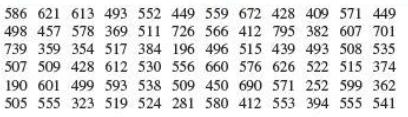
586 621 613 493 552 449 559 672 428 409 571 449 498 457 578 369 511 726 566 412 795 382 607 701 739 359 354 517 384 196 496 515 439 493 508 535 507 509 428 612 530 556 660 576 626 522 515 374 190 601 499 593 538 509 450 690 571 252 599 362 505 555 323 519 524 281 580 412 553 394 555 541
Step by Step Solution
3.31 Rating (172 Votes )
There are 3 Steps involved in it
2 7 128 72 therefore use 7 classes Estimated Class Width7951907864 100 a b c Frequency Relative R... View full answer

Get step-by-step solutions from verified subject matter experts
Document Format (1 attachment)
483-M-S-N-S (877).docx
120 KBs Word File