

Question: The following table shows data for a simple production function. a. From the information in the table, calculate total and average products. b. Graph the
The following table shows data for a simple production function.
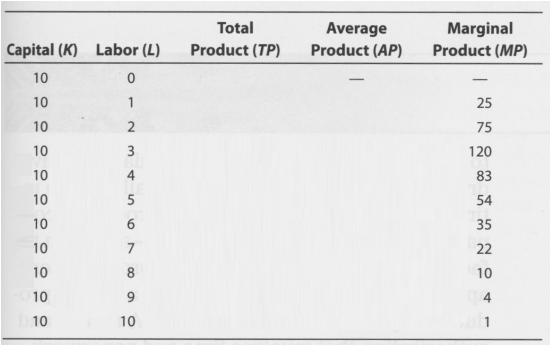
a. From the information in the table, calculate total and average products.
b. Graph the three functions (put total product on one graph and marginal and average products on another).
c. For what range of output does this function have diminishing marginal returns?
d. At what output is average product maximized?
Total Product (TP) Average Product (AP) Marginal Product (MP) Capital (K) Labor (L) 25 75 120 83 54 35 10 2 10 10 10 10 10 10 10 4 10 4 10
Step by Step Solution
3.36 Rating (171 Votes )
There are 3 Steps involved in it
a b See text answers for graphs c After the third worker or output of 220 there ... View full answer

Get step-by-step solutions from verified subject matter experts
Document Format (1 attachment)
655-B-E-M-E (4828).docx
120 KBs Word File