

Question: The following table shows data for the simple production function used in Question 1. Capital costs this firm $20 per unit, and labor costs $10
The following table shows data for the simple production function used in Question 1. Capital costs this firm $20 per unit, and labor costs $10 per worker.
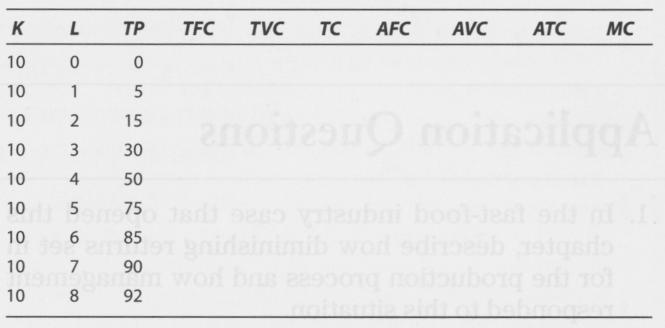
a. From the information in the table, calculate total fixed cost (TFC), total variable cost (TVC), total cost (TC), average fixed cost (AFC), average variable cost (AVC), average total cost (ATC), and marginal cost (MC).
b. Graph your results, putting TFC, TVC, and TC on one graph and AFC, AVC, ATC, and MC on another.
c. At what point is average total cost minimized? At what point is average variable cost minimized?
K L TP TFC TVC TC AFC AVC ATC MC 10 0 10 1 10 2 15 10 3 30 10 4 50 10 5 75 10 6 85 10 7 90 10 8 92 5
Step by Step Solution
3.62 Rating (170 Votes )
There are 3 Steps involved in it
a b See Figure 52 in the text c Average total cost ... View full answer

Get step-by-step solutions from verified subject matter experts
Document Format (1 attachment)
655-B-E-M-E (4831).docx
120 KBs Word File