

Question: The following table shows the frequency distribution for the mileage on a sample of Avis rental cars: a. Calculate the approximate average mileage per car
The following table shows the frequency distribution for the mileage on a sample of Avis rental cars:
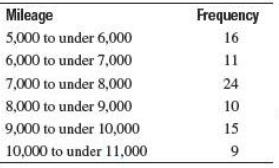
a. Calculate the approximate average mileage per car for the sample.
b. Calculate the approximate variance and standard deviation for the sample.
Frequency 16 Mileage 5,000 to under 6,000 6,000 to under 7,000 7,000 to under 8,000 8,000 to under 9,000 9,000 to under 10,000 10,000 to under 11,000 10 15
Step by Step Solution
★★★★★
3.53 Rating (174 Votes )
There are 3 Steps involved in it
1 Expert Approved Answer
Step: 1 Unlock

Mileage Midpoint 5000 to under 6000 5500 6000 to under 700... View full answer
Question Has Been Solved by an Expert!
Get step-by-step solutions from verified subject matter experts
Step: 2 Unlock
Step: 3 Unlock
Document Format (1 attachment)
483-M-S-N-S (988).docx
120 KBs Word File