

The percentages of new-vehicle buyers who use the Internet during the shopping process are shown in Table
Question:
The percentages of new-vehicle buyers who use the Internet during the shopping process are shown in Table 19 for various years.
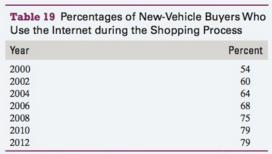
Let p be the percentage of new-vehicle buyers who use the Internet during the shopping process at t years since 2000.
a. Construct a scatterplot.
b. Describe the four characteristics of the association. Compute and interpret r as part of your analysis. Graph the model p = 2.21t + 55.14 on the scatterplot. Does it come close to the data points? What is the slope? What does it mean in this situation? Solve the equation p = 2.21t + 55.14 for t. What is the slope of the model you found in part (e)? What does it mean in this situation?
Fantastic news! We've Found the answer you've been seeking!
Step by Step Answer:
a b There are no outliers The association is linear ...View the full answer

Answered By
Utsab mitra
I have the expertise to deliver these subjects to college and higher-level students. The services would involve only solving assignments, homework help, and others.
I have experience in delivering these subjects for the last 6 years on a freelancing basis in different companies around the globe. I am CMA certified and CGMA UK. I have professional experience of 18 years in the industry involved in the manufacturing company and IT implementation experience of over 12 years.
I have delivered this help to students effortlessly, which is essential to give the students a good grade in their studies.
2+ Reviews
10+ Question Solved
Related Book For 

Question Posted:
