

Question: The phase diagram in figure can be interpreted to yield information on how the boiling and melting points of water change with altitude. (a) Explain
The phase diagram in figure can be interpreted to yield information on how the boiling and melting points of water change with altitude.
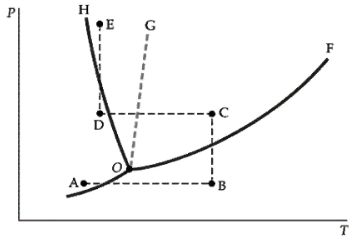
(a) Explain how this information can be obtained.
(b) How might this information affect cooking procedures in the mountains?
A
Step by Step Solution
★★★★★
3.34 Rating (169 Votes )
There are 3 Steps involved in it
1 Expert Approved Answer
Step: 1 Unlock

a With increasing altitude P decreases from curve OF T of l... View full answer
Question Has Been Solved by an Expert!
Get step-by-step solutions from verified subject matter experts
Step: 2 Unlock
Step: 3 Unlock
Document Format (1 attachment)
10-P-T-T-P (111).docx
120 KBs Word File