

Question: The Protek Company is a large manufacturer and distributor of electronic components. Because of some successful new products marketed to manufacturers of personal computers, the
The Protek Company is a large manufacturer and distributor of electronic components. Because of some successful new products marketed to manufacturers of personal computers, the firm has recently undergone a period of explosive growth, more than doubling its revenues during the last two years. However, the growth has been accompanied by a marked decline in profitability and a precipitous drop in the company’s stock price. You are a financial consultant who has been retained to analyze the company’s performance and find out what’s going wrong. Your investigative plan involves conducting a series of in-depth interviews with management and doing some independent research on the industry. However, before starting, you want to focus your thinking to be sure you can ask the right questions. You’ll begin by analyzing the firm’s financial statements over the last three years, which are shown below. The following additional information is provided with the financial statements. Depreciation for 20X1, 20X2, and 20X3 was $200, $250, and $275 million,
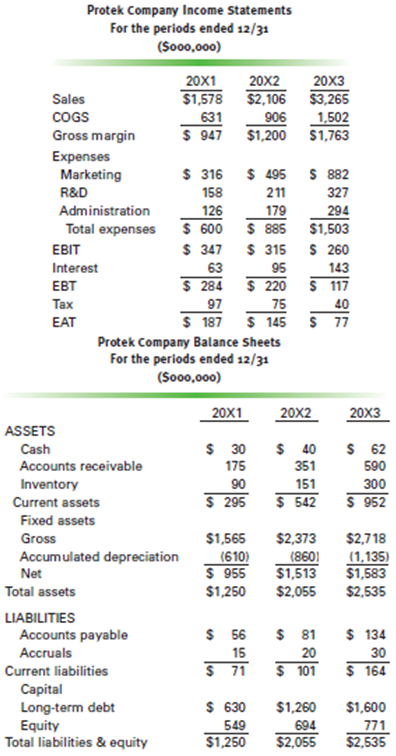
Respectively No stock was sold or repurchased, and, like many fast-growing companies, Protek paid no dividends. Assume the tax rate is a flat 34%, and the firm pays 10% interest on its debt.
a. Construct common size income statements for 20X1, 20X2, and 20X3. Analyze the trend in each line. What appears to be happening?
b. Construct statements of cash flows for 20X2 and 20X3. Where is the company’s money going to and coming from? Make a comment about its free cash flows during the period. Is it likely to have positive or negative free cash flows in the future?
c. Calculate the indicated ratios for all three years. Analyze trends in each ratio and compare each with the industry average. What can you infer from this information? Make specific statements about liquidity, asset management, especially receivables and inventories, debt management, and profitability. Do not simply say that ratios are higher or lower than the average or that they are going up or down. Think about what might be going on in the company and propose reasons why the ratios are acting as they are. Use only ending balance sheet figures to calculate your ratios. Do certain specific problems tend to affect more than one ratio? Which ones?
-2.png)
d. Construct both Du Pont equations for Protek and the industry. What, if anything, do they tell us?
e. One hundred million shares of stock have been outstanding for the entire period. The price of Protek stock in 20X1, 20X2, and 20X3 was $39.27, $26.10, and $11.55, respectively. Calculate the firm’s earnings per share (EPS) and its price/earnings ratio (P/E). What’s happening to the P/E? To what things are investors likely to be reacting? How would a slowdown in personal computer sales affect your reasoning?
f. Would you recommend Protek stock as an investment? Why might it be a very bad investment in the near future? Why might it be a very goodone?
Protek Company Income Statements For the periods ended 12/31 (5000,00o) 20X120X2 20X3 $1,578 $2,106 3,265 .906 1.502 $ 947 $1,200 S1,763 631 COGS Gross margin Expenses Marketing R&D Administration Total expenses 316 495 S 882 158 211 327 294 600 885 $1,503 347 S 315 S 260 143 $ 284 220 S 117 126 179 EBIT Interest EBT 95 EAT $ 187 145 S 77 Protek Company Balance Sheets For the periods ended 12/31 Sooo,000) 20X1 EUAT 20X2 ASSETS $ 30 $40 S 62 590 300 $ 295 542 S952 Accounts receivable Inventory 175 90 351 151 Current assets Fixed assets Gross Accumulated depreciation 610)(860 11.135 $1,565 $2,373 $2,718 Net $ 955 1,513 $1,583 $1,250 $2,055 $2,535 Total assets LIABILITIES Accounts payable Accruals $ 56 81 134 30 15 20 Current liabilities $ 71 101 164 Capital Long-term debt Equity $ 630 1,260 $1.600 Total liabilities & equity $1,250 2,055 $2,535 Industry Average x1 20x2 20x3 Current ratio Quick ratio ACP Inventory turnover Fixed asset turnover Total asset turnover Debt ratio Debt equity TIE ROS ROA ROE Equity multiplier 4.5 3.2 42 days 7.5 1.6x 1.2X 53% 4.5 9.0% 10.8% 22.8% 2.1
Step by Step Solution
3.34 Rating (169 Votes )
There are 3 Steps involved in it
a 20X1 20X2 20X3 Sales 1578 1000 2106 1000 3265 1000 COGS 631 400 906 430 1502 460 Gross Margin 947 600 1200 570 1763 540 Expenses Marketing 316 200 495 235 882 270 R D 158 100 211 100 327 100 Admin 1... View full answer

Get step-by-step solutions from verified subject matter experts
Document Format (1 attachment)
171-B-C-F-F-P-M (485).docx
120 KBs Word File