

Question: Consider the multiple regression model fit to the house price data in Problem 3.7. Problem 3.7 Consider the house price data in Table B.4. a.
Consider the multiple regression model fit to the house price data in Problem 3.7.
Problem 3.7
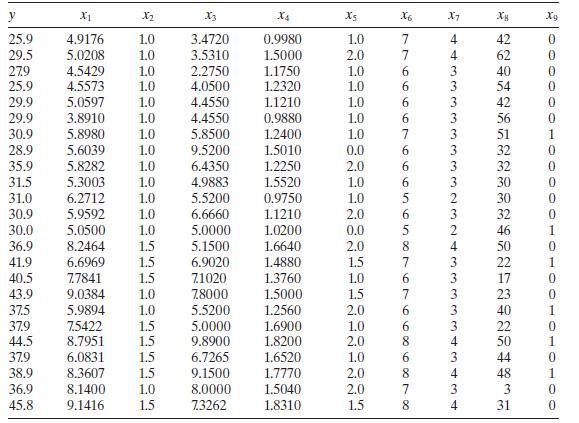
Consider the house price data in Table B.4.
a. Construct a normal probability plot of the residuals. Does there seem to be any problem with the normality assumption?
b. Construct and interpret a plot of the residuals versus the predicted response.
c. Construct the partial regression plots for this model. Does it seem that some variables currently in the model are not necessary?
d. Compute the studentized residuals and the $R$-student residuals for this model. What information is conveyed by these scaled residuals?
X1 X2 X3 X4 Xs X6 5 X7 25.9 4.9176 1.0 3.4720 0.9980 1.0 29.5 5.0208 1.0 3.5310 1.5000 2.0 27.9 4.5429 1.0 2.2750 1.1750 1.0 25.9 4.5573 1.0 4.0500 1.2320 1.0 29.9 5.0597 1.0 4.4550 1.1210 1.0 29.9 3.8910 1.0 4.4550 0.9880 1.0 30.9 5.8980 1.0 5.8500 1.2400 1.0 28.9 5.6039 1.0 9.5200 1.5010 0.0 35.9 5.8282 1.0 6.4350 1.2250 2.0 31.5 5.3003 1.0 4.9883 1.5520 1.0 31.0 6.2712 1.0 5.5200 0.9750 1.0 30.9 5.9592 1.0 6.6660 1.1210 2.0 30.0 5.0500 1.0 5.0000 1.0200 0.0 36.9 8.2464 1.5 5.1500 1.6640 2.0 41.9 6.6969 1.5 6.9020 1.4880 1.5 40.5 7.7841 1.5 71020 1.3760 1.0 43.9 9.0384 1.0 7.8000 1.5000 1.5 37.5 5.9894 1.0 5.5200 1.2560 2.0 37.9 7.5422 1.5 5.0000 1.6900 1.0 44.5 8.7951 1.5 9.8900 1.8200 2.0 37.9 6.0831 1.5 6.7265 1.6520 1.0 38.9 8.3607 1.5 9.1500 1.7770 2.0 36.9 8.1400 1.0 8.0000 1.5040 2.0 45.8 9.1416 1.5 7.3262 1.8310 1.5 996666966656587676606 2 AA A + 4 42 4 62 0 3 40 3 3 3 3 1 3 32 3 32 3 2 3 4 3 3 3 3 3 88248 4 4 48 3 3 4 31 10100
Step by Step Solution
3.54 Rating (171 Votes )
There are 3 Steps involved in it

Get step-by-step solutions from verified subject matter experts