

The following graph shows the U.S. passenger airlines accident report for the years 20002007. How many accidents
Question:
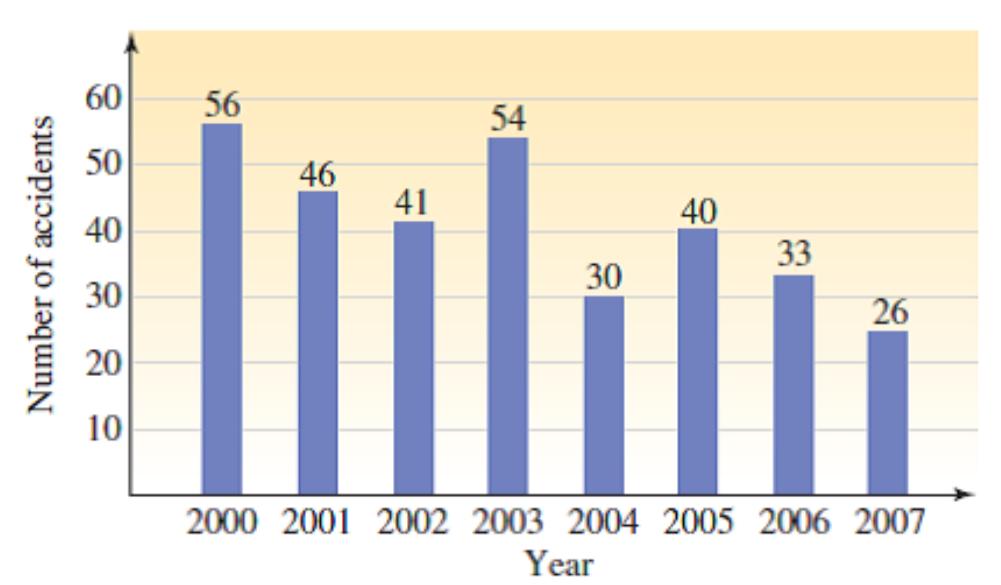
The following graph shows the U.S. passenger airlines accident report for the years 2000–2007. How many accidents were there in this 8-year time span?
Fantastic news! We've Found the answer you've been seeking!
Step by Step Answer:
US Passenger Airlines Accident Report The following table shows the total number of ac...View the full answer

Answered By
Dorcus Mwamisi
I've much experience in tutoring
I've tutored a lot of students in my field of works and they have done greatly in their academics
I
0 Reviews
10+ Question Solved
Related Book For 

Question Posted:
