

The systolic blood pressure of individuals is thought to be related to both age and weight. For
Question:
The systolic blood pressure of individuals is thought to be related to both age and weight. For a random sample of 11 men, the following data were obtained:
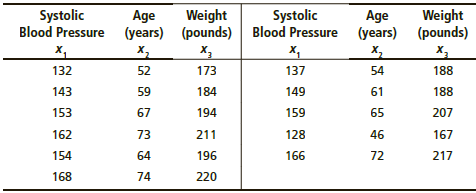
(a) Generate summary statistics, including the mean and standard deviation of each variable compute the coefficient of variation for each variable. Relative to its mean, which variable has greatest spread of data values? Which variable has the smallest spread of data values relative to its mean?
(b) For each pair of variables, generate the sample correlation coefficient r. Compute the corresponding coefficient of determination r2. Which variable (other than x1) has the greatest influence (by itself) on x1? Would you say that both variables x2 and x3 show a strong influence on x1 ? Explain your answer. What percent of the variation in x1 can be explained by the corresponding variation in x2 ? Answer the same question for x3 .
(c) Perform a regression analysis with x1 as the response variable. Use x2 and x3 as explanatory variables. Look at the coefficient of multiple determination. What percentage of the variation in x1 can be explained by the corresponding variations in x2 and x3 taken together?
(d) Look at the coefficients of the regression equation. Write out the regression equation. Explain how each coefficient can be thought of as a slope. If age were held fixed, but a person put on 10 pounds, what would you expect for the corresponding change in systolic blood pressure? If a person kept the same weight but got 10 years older, what would you expect for the corresponding change in systolic blood pressure?
(e) Test each coefficient to determine if it is zero or not zero. Use level of significance 5%. Why would the outcome of each test help us determine whether or not a given variable should be used in the regression model?
(f) Find a 90% confidence interval for each coefficient.
(g) Suppose Michael is 68 years old and weighs 192 pounds. Predict his systolic blood pressure, and find a 90% confidence range for your prediction (if your software produces prediction intervals).
Step by Step Answer:
a Relative to its mean x 2 has the greatest spread of ...View the full answer


Understandable Statistics Concepts And Methods
ISBN: 9781337119917
12th Edition
Authors: Charles Henry Brase, Corrinne Pellillo Brase
