

Question: The table below shows annual financial data for a sample of 20 companies in the food consumer products sector. Research question: At = .01,
The table below shows annual financial data for a sample of 20 companies in the food consumer products sector. Research question: At α = .01, is there a significant correlation between revenue and pro t? Why is a rank correlation preferred? What factors might result in a less- than-perfect correlation?
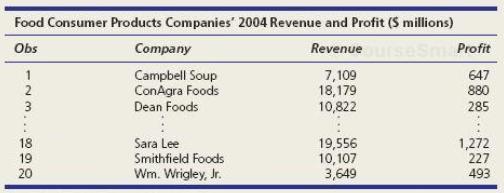
Food Consumer Products Companies' 2004 Revenue and Profit (S millions) Obs Company Revenue Profit Campbell Soup ConAgra Foods Dean Foods 7,109 18,179 10,822 647 880 285 18 19 20 Sara Lee Smithfield Foods Wm. Wrigley, Jr 19,556 10,107 3,649 1,272 227 493
Step by Step Solution
3.39 Rating (161 Votes )
There are 3 Steps involved in it
The Spearman rank correlation is preferred with sk... View full answer

Get step-by-step solutions from verified subject matter experts
Document Format (1 attachment)
485-M-S-N-S (1097).docx
120 KBs Word File