

Question: The table given below shows a sample of the driving distances (in yards) for two golfers. At = 0.10, can you conclude that the
The table given below shows a sample of the driving distances (in yards) for two golfers. At α = 0.10, can you conclude that the variances of the driving distances differ between the two golfers?
(a) Identify the claim and state H0 and Ha,
(b) Find the critical value and identify the rejection region,
(c) Find the test statistic F,
(d) Decide whether to reject or fail to reject the null hypothesis,
(e) Interpret the decision in the context of the original claim. Assume the samples are random and independent, and the populations are normally distributed. If convenient, use technology.
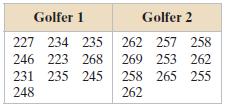
Golfer 1 Golfer 2 227 234 235 262 257 258 246 223 268 269 253 262 231 235 245 258 265 255 248 262
Step by Step Solution
3.29 Rating (173 Votes )
There are 3 Steps involved in it
Population 1 Golfer 1 Population 2 Golfer 2 a The claim is the variances of the driving dist... View full answer

Get step-by-step solutions from verified subject matter experts
Document Format (1 attachment)
598-M-S-C-S-T (873).docx
120 KBs Word File