

Question: The table given below shows a sample of the waiting times (in days) for a heart transplant for two age groups. At = 0.05,
The table given below shows a sample of the waiting times (in days) for a heart transplant for two age groups. At α = 0.05, can you conclude that the variances of the waiting times differ between the two age groups?
(a) Identify the claim and state H0 and Ha,
(b) Find the critical value and identify the rejection region,
(c) Find the test statistic F,
(d) Decide whether to reject or fail to reject the null hypothesis,
(e) Interpret the decision in the context of the original claim. Assume the samples are random and independent, and the populations are normally distributed. If convenient, use technology.
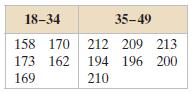
18-34 158 170 212 209 213 173 162 194 196 200 35-49 169 210
Step by Step Solution
3.38 Rating (164 Votes )
There are 3 Steps involved in it
Population 1 Age group 3549 Population 2 Age group 1834 a The claim is the variances of the wa... View full answer

Get step-by-step solutions from verified subject matter experts
Document Format (1 attachment)
598-M-S-C-S-T (872).docx
120 KBs Word File