

Question: The table shows some data from a sample of heights of fathers and their sons. The scatterplot (not shown) suggests a linear trend. a. Find
The table shows some data from a sample of heights of fathers and their sons. The scatterplot (not shown) suggests a linear trend.
a. Find and report the regression equation for predicting the son€™s height from the father€™s height. Then predict the height of a son with a father 74 inches tall. Also predict the height of a son of a father who is 65 inches tall.
b. Find and report the regression equation for predicting the father€™s height from the son€™s height. Then predict a father€™s height from that of a son who is 74 inches tall and also predict a father€™s height from that of a son who is 65 inches tall.
c. What phenomenon does this show?
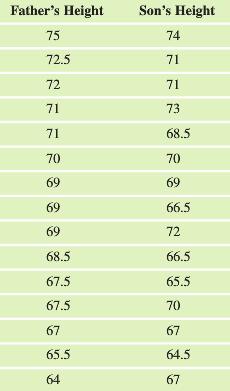
Father's Height 75 72.5 72 71 71 Son's Height 74 71 71 73 68.5 69 69 69 68.5 67.5 67.5 67 65.5 64 69 66.5 72 66.5 65.5 70 67 64.5 67
Step by Step Solution
3.42 Rating (165 Votes )
There are 3 Steps involved in it
a Predicted Sons Height 1583 07685 Fathers Height Predicted Sons ... View full answer

Get step-by-step solutions from verified subject matter experts
Document Format (1 attachment)
484-M-S-L-R (2798).docx
120 KBs Word File