

Question: The data shown in the table are the numbers of years of formal education of the fathers and mothers of a sample of 29 statistics
The data shown in the table are the numbers of years of formal education of the fathers and mothers of a sample of 29 statistics students at a small community college in an area with many recent immigrants. (The means are both about 8, and the standard deviations are both about 4.6.) The scatterplot (not shown) suggests a linear trend.
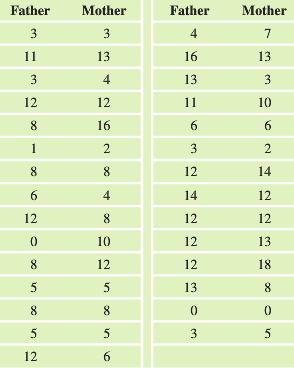
a. Find and report the regression equation for predicting the mother€™s years of education from the father€™s. Then find the predicted number of years for the mother if the father has 12 years of education, and find the predicted number of years for a mother if the father has 4 years of education.
b. Find and report the regression equation for predicting the father€™s years of education from the mother€™s. Then find the predicted number of years for the father if the mother has 12 years of education, and find the predicted number of years for the father if the mother has 4 years of education.
c. What phenomenon from the chapter does this demonstrate? Explain.
th 73306242238805 h4.6 3 1 6 3 2 4 2 2 2303 th 3 34262848025856 313281862085852
Step by Step Solution
3.48 Rating (171 Votes )
There are 3 Steps involved in it
a Predicted Mothers Education 312 0637 Fathers Education Predicted Mothers Edu... View full answer

Get step-by-step solutions from verified subject matter experts
Document Format (1 attachment)
484-M-S-L-R (2797).docx
120 KBs Word File