

Question: The table shows the ages (in years) for a sample of professional athletes from several sports. At = 0.05, can you conclude that at
The table shows the ages (in years) for a sample of professional athletes from several sports. At α = 0.05, can you conclude that at least one mean age is different from the others?
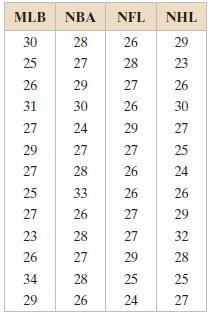
(a) Identify the claim and state H0 and Ha,
(b) Find the critical value and identify the rejection region,
(c) Find the test statistic F,
(d) Decide whether to reject or fail to reject the null hypothesis,
(e) Interpret the decision in the context of the original claim. Assume the samples are random and independent, the populations are normally distributed, and the population variances are equal. If convenient, use technology.
93607 2223222223222 1-26 2 26 29 27 26 26 27 27 29 25 24 0478368786 2223222322222 87 25 7573649 23222222232
Step by Step Solution
3.34 Rating (166 Votes )
There are 3 Steps involved in it
a The claim is at least one mean ... View full answer

Get step-by-step solutions from verified subject matter experts
Document Format (1 attachment)
598-M-S-C-S-T (903).docx
120 KBs Word File