

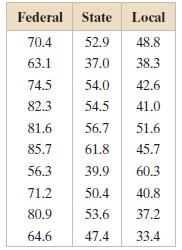
The table shows the salaries (in thousands of dollars) for a sample of individuals from the federal,
Question:
The table shows the salaries (in thousands of dollars) for a sample of individuals from the federal, state, and local levels of government. At α = 0.01, can you conclude that at least one mean salary is different from the others?
(a) Identify the claim and state H0 and Ha,
(b) Find the critical value and identify the rejection region,
(c) Find the test statistic F,
(d) Decide whether to reject or fail to reject the null hypothesis,
(e) Interpret the decision in the context of the original claim. Assume the samples are random and independent, the populations are normally distributed, and the population variances are equal. If convenient, use technology.
Fantastic news! We've Found the answer you've been seeking!
Step by Step Answer:
a The claim is at least one ...View the full answer

Answered By
Pharashram rai
i am highly creative, resourceful and dedicated freelancer an excellent record of successful classroom presentations and writing . I have more than 4 years experience in tutoring students especially by using my note making strategies and engineering field . Especially adept at teaching methods of maths and writing , and flexible teaching style with the willingness to work beyond the call of duty. Committed to ongoing professional development and spreading the knowledge within myself to the blooming ones to make them fly with .
65+ Reviews
270+ Question Solved
Related Book For 

Elementary Statistics Picturing The World
ISBN: 9780321911216
6th Edition
Authors: Ron Larson, Betsy Farber
Question Posted:
