

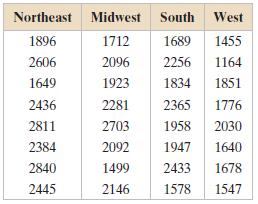
Question: The table shows the amounts spent (in dollars) on energy in one year for a sample of households from four regions of the United States.
The table shows the amounts spent (in dollars) on energy in one year for a sample of households from four regions of the United States. At α = 0.10, can you conclude that the mean amount spent on energy in one year is different in at least one of the regions?
(a) Identify the claim and state H0 and Ha,
(b) Find the critical value and identify the rejection region,
(c) Find the test statistic F,
(d) Decide whether to reject or fail to reject the null hypothesis, and
(e) Interpret the decision in the context of the original claim. Assume the samples are random and independent, the populations are normally distributed, and the population variances are equal. If convenient, use technology.
Northeast Midwest South West 1712 1689 1455 2096 2256 1164 1923 1834 1851 22812365 1776 2703 1958 2030 2092 19471640 1499 2433 1678 2146 1578 1547 1896 2606 1649 2436 2811 2384 2840 2445
Step by Step Solution
3.41 Rating (157 Votes )
There are 3 Steps involved in it
a The claim is the mean amount spent on energy in one ... View full answer

Get step-by-step solutions from verified subject matter experts
Document Format (1 attachment)
598-M-S-C-S-T (910).docx
120 KBs Word File