

Question: The table shows the annual incomes (in dollars) for a sample of families from four regions of the United States. At = 0.05, can
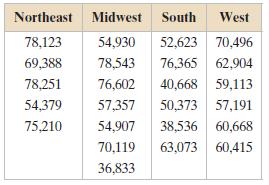
The table shows the annual incomes (in dollars) for a sample of families from four regions of the United States. At α = 0.05, can you conclude that the mean annual income of families is different in at least one of the regions?
(a) Identify the claim and state H0 and Ha,
(b) Find the critical value and identify the rejection region,
(c) Find the test statistic F,
(d) Decide whether to reject or fail to reject the null hypothesis, and
(e) Interpret the decision in the context of the original claim. Assume the samples are random and independent, the populations are normally distributed, and the population variances are equal. If convenient, use technology.
Northeast Midwest South West 78,123 54,930 52.623 70,496 69,388 78543 76365 62,904 78,25176,602 40,668 59,113 54,379 57357 50,373 57,191 75,210 54,90738,536 60,668 70,119 63,073 60,415 36,833
Step by Step Solution
3.31 Rating (178 Votes )
There are 3 Steps involved in it
a The claim is at least one of the mean incomes is di... View full answer

Get step-by-step solutions from verified subject matter experts
Document Format (1 attachment)
598-M-S-C-S-T (911).docx
120 KBs Word File