

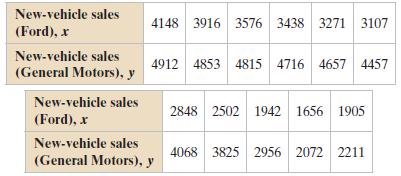
The table shows the numbers of new-vehicle sales (in thousands) in the United States for Ford and
Question:
The table shows the numbers of new-vehicle sales (in thousands) in the United States for Ford and General Motors for 11 years. The equation of the regression line is ŷ = 1.200x + 433.900.
Use the data to find
(a) The coefficient of determination r2 and interpret the result,
(b) The standard error of estimate se and interpret the result.
Fantastic news! We've Found the answer you've been seeking!
Step by Step Answer:
a About 899 of the variation in the newvehicle sales of General Motors can be ...View the full answer

Answered By
Muhammad Umair
I have done job as Embedded System Engineer for just four months but after it i have decided to open my own lab and to work on projects that i can launch my own product in market. I work on different softwares like Proteus, Mikroc to program Embedded Systems. My basic work is on Embedded Systems. I have skills in Autocad, Proteus, C++, C programming and i love to share these skills to other to enhance my knowledge too.
1+ Reviews
10+ Question Solved
Related Book For 

Elementary Statistics Picturing The World
ISBN: 9780321911216
6th Edition
Authors: Ron Larson, Betsy Farber
Question Posted:
