

The worksheet Data in the Excel file Airport Service Times lists a large sample of the times
Question:
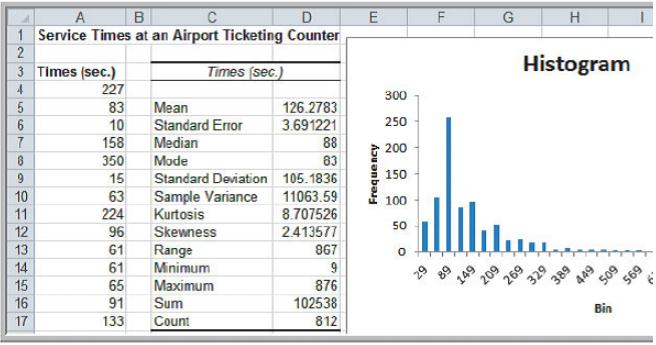
The worksheet Data in the Excel file Airport Service Times lists a large sample of the times in seconds to process customers at a ticket counter. The second worksheet shows a frequency distribution and histogram of the data.
a. Summarize the data using the Descriptive Statistics tool. What can you say about the shape of the distribution of times?
b. Find the 90th percentile.
c. How might the airline use these results to manage its ticketing counter operations?
The word "distribution" has several meanings in the financial world, most of them pertaining to the payment of assets from a fund, account, or individual security to an investor or beneficiary. Retirement account distributions are among the most...
Fantastic news! We've Found the answer you've been seeking!
Step by Step Answer:
Airport Service Times Times sec 26 358 218 71 190 36 45 68 45 66 132 372 125 16 37 116 145 160 276 132 124 180 111 119 75 164 39 698 46 172 151 83 166 78 68 502 83 139 19 44 117 38 176 128 18 427 72 1...View the full answer

Answered By
Nazrin Ziad
I am a post graduate in Zoology with specialization in Entomology.I also have a Bachelor degree in Education.I posess more than 10 years of teaching as well as tutoring experience.I have done a project on histopathological analysis on alcohol treated liver of Albino Mice.
I can deal with every field under Biology from basic to advanced level.I can also guide you for your project works related to biological subjects other than tutoring.You can also seek my help for cracking competitive exams with biology as one of the subjects.
2+ Reviews
10+ Question Solved
Related Book For 

Business Analytics Methods Models and Decisions
ISBN: 978-0321997821
2nd edition
Authors: James R. Evans
Question Posted:
