

Question: This exercise requires the use of a computer package. The authors of the article Absolute Versus per Unit Body Length Speed of Prey as an
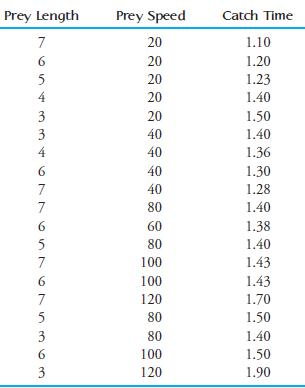
This exercise requires the use of a computer package. The authors of the article “Absolute Versus per Unit Body Length Speed of Prey as an Estimator of Vulnerability to Predation” (Animal Behaviour [1999]: 347– 352) found that the speed of a prey (twips/s) and the length of a prey (twips 100) are good predictors of the time (s) required to catch the prey. (A twip is a measure of distance used by programmers.) Data were collected in an experiment in which subjects were asked to “catch” an animal of prey moving across his or her computer screen by clicking on it with the mouse. The investigators varied the length of the prey and the speed with which the prey moved across the screen. The following data are consistent with summary values and a graph given in the article. Each value represents the average catch time over all subjects. The order of the various speed- length combinations was randomized for each subject.
a. Fit a multiple regression model for predicting catch time using prey length and speed as predictors.
b. Predict the catch time for an animal of prey whose length is 6 and whose speed is 50.
c. Is the multiple regression model useful for predicting catch time? Test the relevant hypotheses using a = .05.
d. The authors of the article suggest that a simple linear regression model with the single predictor  might be a better model for predicting catch time. Calculate the x values and use them to fit this linear regression model.
e. Which of the two models considered (the multiple regression model from Part (a) or the simple linear regression model from Part (d)) would you recommend for predicting catch time? Justify your choice.
Prey Length y Speed Catch Time 20 20 20 20 20 40 40 40 40 80 60 80 100 100 120 80 80 100 120 1.10 1.20 1.23 1.40 1.50 1.40 1.36 1.30 1.28 1.40 1.38 1.40 1.43 1.43 1.70 1.50 1.40 1.50 1.90 xlength speed
Step by Step Solution
3.36 Rating (165 Votes )
There are 3 Steps involved in it
a The MINITAB output is shown below The estimated regression equation is 1 2 y 143958 005227x 000397... View full answer

Get step-by-step solutions from verified subject matter experts
Document Format (1 attachment)
536-M-S-L-R (4312).docx
120 KBs Word File