

Question: Three events are shown on the Venn diagram in the following figure: Reproduce the figure and shade the region that corresponds to each of the
Three events are shown on the Venn diagram in the following figure:
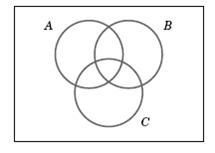
Reproduce the figure and shade the region that corresponds to each of the following events.
(a) A’
(b) A ∩ B
(c) (A ∩ B) U C
(d) (B U C)’
(e) (A ∩ B)’ U C
A
Step by Step Solution
★★★★★
3.50 Rating (157 Votes )
There are 3 Steps involved in it
1 Expert Approved Answer
Step: 1 Unlock

a b 3 ... View full answer
Question Has Been Solved by an Expert!
Get step-by-step solutions from verified subject matter experts
Step: 2 Unlock
Step: 3 Unlock
Document Format (1 attachment)
M-S (17).docx
120 KBs Word File