

Question: Use EXCELs regression tools to analyze and forecast future sales. a.Create a spreadsheet with the following data about targeted emails, click ads, and unit sales:
Use EXCEL’s regression tools to analyze and forecast future sales.
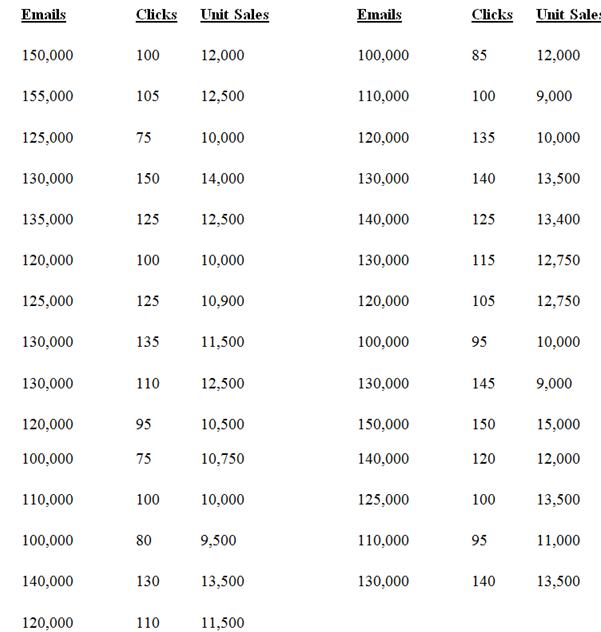
a.Create a spreadsheet with the following data about targeted emails, click ads, and unit sales:
b. Create a scatter graph to illustrate the relationship between targeted emails and unit sales. Display the regression equation and the R2 between the two variables on the chart.
c. Create a scatter graph to illustrate the relationship between click ads and unit sales. Display the regression equation and the R2 between the two variables on the chart.
d. Which variable (targeted emails or click ads) has the greater influence on unit sales? How do you know?
e. Use the “=Forecast “function to display the forecasted sales for 200,000 targeted emails and for 200 click ads.
Emails Clicks Unit Sales Emails Clicks Unit Sales 150,000 100 12,000 100,000 85 12,000 155,000 105 12,500 110,000 100 9,000 125,000 75 10,000 120,000 135 10,000 130,000 150 14,000 130,000 140 13,500 135,000 125 12,500 140,000 125 13,400 120,000 100 10,000 130,000 115 12,750 125,000 125 10,900 120,000 105 12,750 130,000 135 11,500 100,000 95 10,000 130,000 110 12,500 130,000 145 9,000 120,000 95 10,500 150,000 150 15,000 100,000 75 10,750 140,000 120 12,000 110,000 100 10,000 125,000 100 13,500 100,000 80 9,500 110,000 95 11,000 140,000 130 13,500 130,000 140 13,500 120,000 110 11,500
Step by Step Solution
3.30 Rating (168 Votes )
There are 3 Steps involved in it
a b c Targeted emails have a greater effect on unit sales than do click ads as shown by the higher R 2 for the regression formula d Formula to forecas... View full answer

Get step-by-step solutions from verified subject matter experts
Document Format (1 attachment)
373-B-A-I-S (4945).docx
120 KBs Word File