

Question: Use technology to calculate the correlation coefficient for the data on page 469 on the salaries and average attendances at home games for the teams
Use technology to calculate the correlation coefficient for the data on page 469 on the salaries and average attendances at home games for the teams in Major League Baseball. Interpret the result in the context of the data.
a. Enter the data.
b. Use the appropriate feature to calculate r.
c. Interpret the result in the context of the data.
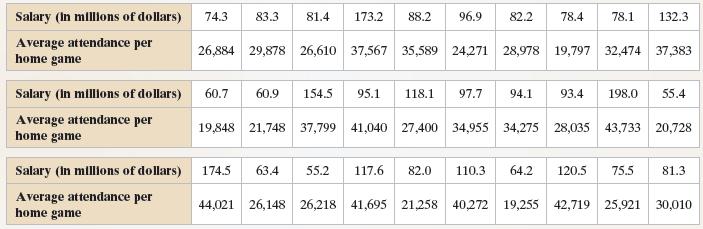
Salary (in mlllions of dollars) 74383.3 81.4 173.2 88.2 96.9 82.2 78.478.1 132.3 Average attendance per home game 26,884 29,878 26,610 37,567 35,589 24,271 28,978 19,797 32.474 37,383 Salary (In millions of dollars) 60.7 60.91545 95.1 118.1 7.794. 93.4 198.0 55.4 Average attendance per home game 19,848 21,748 37,799 41,040 27,400 34,955 34,275 28,035 43,733 20,728 Salary (In millions of dollars) 174 63.4 55.2117.6 82.0 110.3 64.2 2055.5 81.3 Average attendance per home game 44,021 26,148 26,218 41,695 21,258 40272 19,255 42,719 25,921 30,010
Step by Step Solution
3.45 Rating (171 Votes )
There are 3 Steps involved in it
a b r 0769 c Because r is close to ... View full answer

Get step-by-step solutions from verified subject matter experts
Document Format (1 attachment)
598-M-S-L-R (5417).docx
120 KBs Word File