

Question: Variance analysis, multiple products. Debbies Delight, Inc., operates a chain of cookie stores. Budgeted and actual operating data of its three Chicago stores for August
Variance analysis, multiple products. Debbie’s Delight, Inc., operates a chain of cookie stores. Budgeted and actual operating data of its three Chicago stores for August 2009 are as follows:
Debbie’s Delight focuses on contribution margin in its variance analysis.
1. Compute the total sales-volume variance for August 2009.
2. Compute the total sales-mix variance for August 2009.
3. Compute the total sales-quantity variance for August 2009.
4. Comment on your results in requirements 1, 2, and 3.
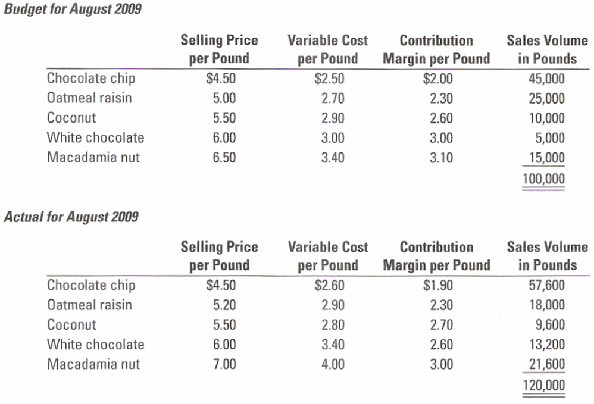
Budget for August 2009 Selling Price per Pound $4.50 Variable Cost Contribution Sales Volume in Pounds per Pound Margin per Pound $2.00 Chocolate chip $2.50 45,000 Oatmeal raisin 5.00 2.70 2.30 25,000 5.50 Coconut 2.90 2.60 10,000 White chocolate 6.00 3.00 3.00 5,000 Macadamia nut 15,000 6.50 3.40 3.10 100,000 Actual for August 2009 TTTI Selling Price per Pound $4.50 Variable Cost Contribution Sales Volume in Pounds per Pound Margin per Pound $1.90 Chocolate chip $2.60 57,600 Oatmeal raisin 5.20 2.90 2.30 18,000 Coconut 2.80 9,600 5.50 2.70 White chocolate 6.00 3.40 2.60 13,200 21,600 120,000 Macadamia nut 7.00 3.00 4.00
Step by Step Solution
3.20 Rating (158 Votes )
There are 3 Steps involved in it
Variance analysis multiple products 1 2 and 3 Solution Exhibit 1434 presents the salesvolume salesqu... View full answer

Get step-by-step solutions from verified subject matter experts
Document Format (1 attachment)
24-B-C-A-C-A (64).docx
120 KBs Word File