

Question: Variance analysis, multiple products. The Detroit Penguins play in the American Ice Hockey League. The Penguins play in the Downtown Arena (owned and managed by
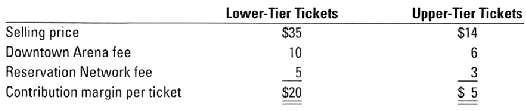
Variance analysis, multiple products. The Detroit Penguins play in the American Ice Hockey League. The Penguins play in the Downtown Arena (owned and managed by the City of Detroit, which has a capacity of 15,000 seats (5,000 lower-tier seats and 10,000 upper-tier seats). The Downtown Arena charges the Penguins a per-ticket charge for use of their facility. All tickets are sold by the Reservation Network, which charges the Penguins a reservation fee per ticket. The Penguins' budgeted contribution margin for each type of ticket in 2010 is computed as follows:
The budgeted and actual average attendance figures per game in the 2010 season are:

There was no difference between the budgeted and actual contribution margin for lower-tier or upper-tier seats. The manager of the Penguins was delighted that actual attendance was 10% above budgeted alien-dance per game, especially given the depressed state of the local economy in the past six months.
1. Compute the sales-volume variance for each type of ticket and in total for the Detroit Penguins in 2010. (Calculate all variances in terms of contribution margins.)
2. Compute the sales-quantity and sales-mix variances for each type of ticket and in total in 2010.
3. Present a summary of the variances in requirements 1 and 2. Comment on theresults.
Lower-Tier Tickets Upper-Tier Tickets Selling price Downtown Arena fee Reservation Netwark fee Contribution margin per ticket $35 10 $14 6. $ 5 $20
Step by Step Solution
3.38 Rating (160 Votes )
There are 3 Steps involved in it
Variance analysis multiple products 1 Lowertier tickets 3300 4000 20 14000 U Uppertier tickets 7700 6000 5 8500 F All tickets 5500 U 2 11 per unit sea... View full answer

Get step-by-step solutions from verified subject matter experts
Document Format (1 attachment)
24-B-C-A-C-A (53).docx
120 KBs Word File